Faultline

A small app built to break, and be found

Break one step.
The trace points
right at it.

Faultline is a small sample-order app. It uses OpenTelemetry to record what happens inside a request. Flip a switch and the simulated database lookup slows down or fails; the trace shows which step changed. It runs locally, and can export traces to an OTLP backend. The Dynatrace screenshots below are saved evidence from a past trial, not a live dashboard.

GET /orders/3fault: error
orders.getrequest · 500
db.queryerror
HTTP 500caught in 1 trace
3manual stages in a found-order lookup
3modes · none / slow / error
24automated checks
0code changes to send it to Dynatrace
§ 01

What you can't
see, you can't fix

When an app is running live, you usually can't see inside it. A request comes in, something is slow or breaks, and all the user sees is "checkout is down," with no clue why. Observability means making each step of the app report what it did, so that black box turns into a timeline you can actually read. Faultline is the smallest honest version of that: a real little app, real reporting, a real monitoring backend, and a switch to break it whenever you want so you can watch the problem get caught.

§ 02

The app, and
the break button

Each HTTP request has an automatic SERVER span, which records its duration and response status. A successful order lookup adds the three manual spans below. The database and simulated shipping spans sit beneath orders.get; all share the same trace. OpenTelemetry also adds spans for sending the HTTP response.

manual · internal
orders.get
The order-handling work, nested beneath the automatic GET /orders/{order_id} server span.
manual · the break point
db.query
An in-memory lookup. The fault switch adds a delay or raises a database error here.
manual · simulated
downstream.shipping
Adds a sample tracking number locally. No shipping service is contacted; skipped for failed or missing orders.

none

Healthy. The lookup returns the order and the request succeeds.

slow

The database step stalls for about two seconds. A slowness problem, not a full outage.

error

The database step fails, the request comes back as an error (HTTP 500), and the trace records exactly where it broke.

flip the break button at runtime
# make the database step fail
curl -X POST localhost:8799/admin/fault \
  -H 'Content-Type: application/json' -d '{"mode":"error"}'
curl localhost:8799/orders/1            # -> HTTP 500, recorded in the trace

# put it back
curl -X POST localhost:8799/admin/fault \
  -H 'Content-Type: application/json' -d '{"mode":"none"}'
curl localhost:8799/orders/1            # -> HTTP 200 again
§ 03

Set up once,
send it anywhere

The same app runs on your laptop or sends its data to a real monitoring tool, with no code change. It just reads a few standard settings: point them at Dynatrace and the data flows there; leave them blank and it runs locally and sends nothing. Being able to switch the destination with settings instead of code is the whole point of OpenTelemetry, and it means a customer is never locked into one vendor.

app/telemetry.py · only send data when a destination is set (shortened)
def configure() -> TracerProvider:
    resource = Resource.create({"service.name": "orders-demo"})
    provider = TracerProvider(resource=resource)

    # Only send the data to a monitoring tool (e.g. Dynatrace) when a destination is set.
    if os.getenv("OTEL_EXPORTER_OTLP_ENDPOINT"):
        provider.add_span_processor(BatchSpanProcessor(OTLPSpanExporter()))

    trace.set_tracer_provider(provider)
    return provider
§ 04

Seen in
Dynatrace

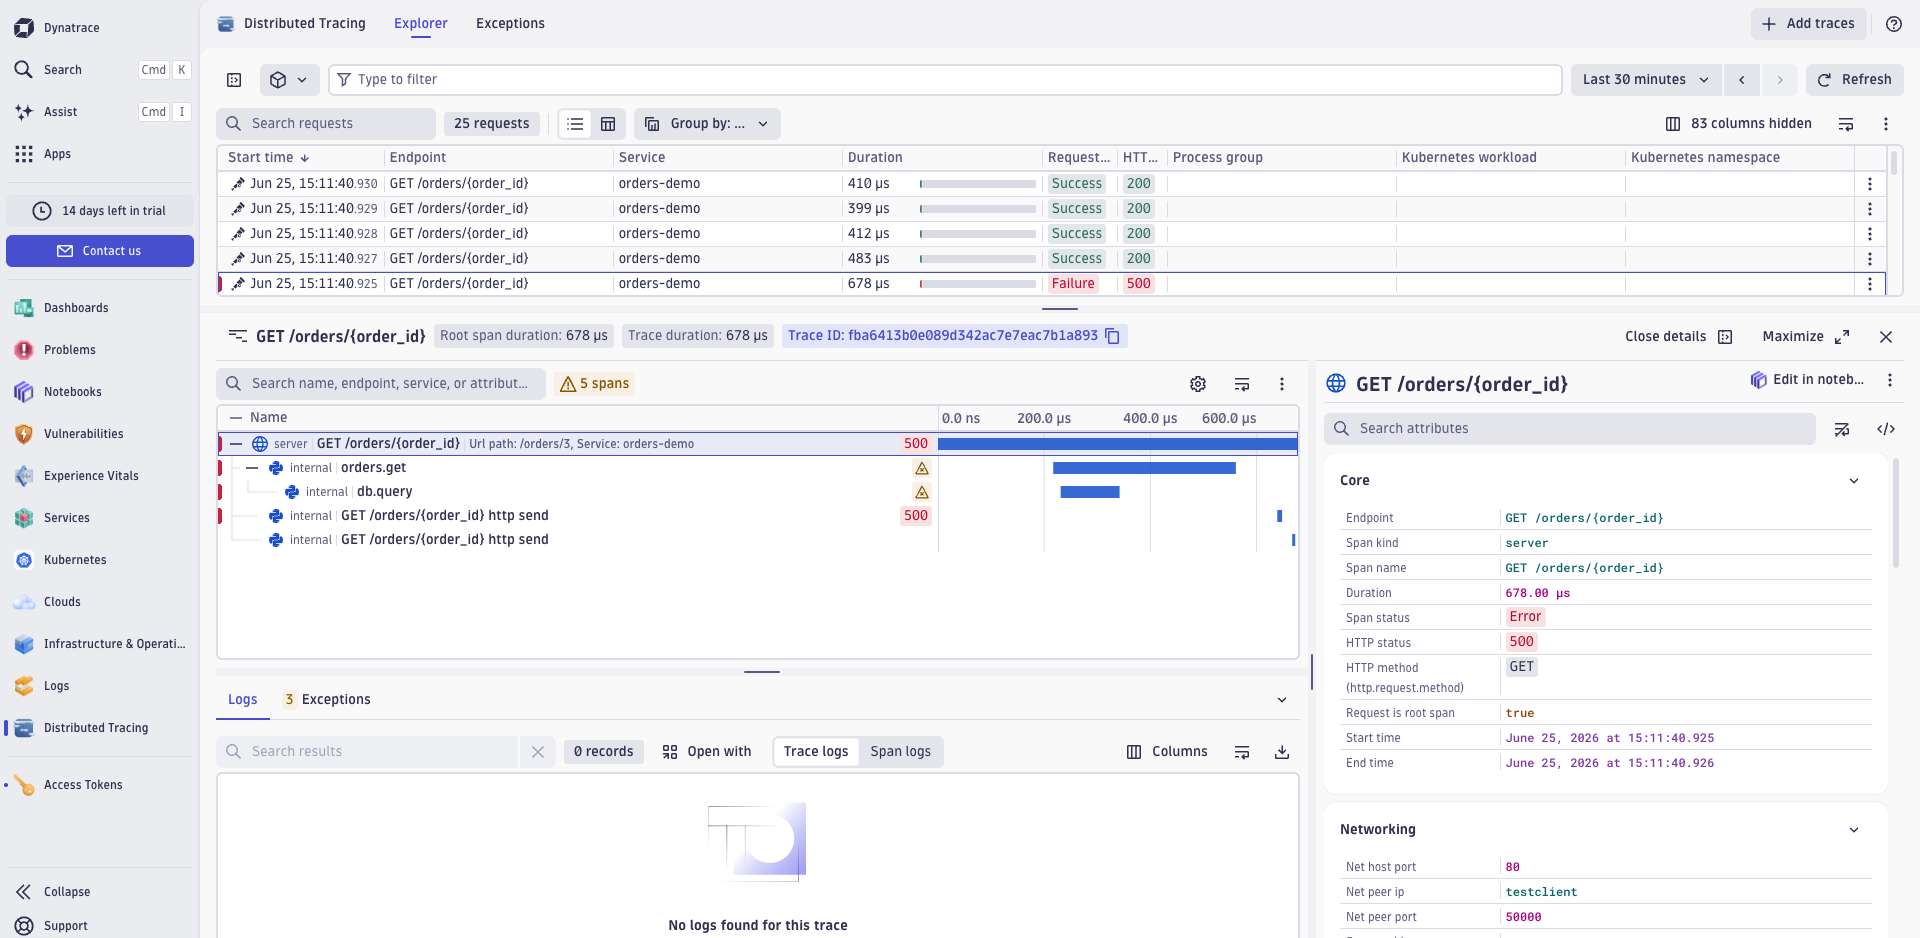
These screenshots are from a past Dynatrace trial session (that trial has since expired). The app showed up on its own, with both healthy and failing requests. Opening a failing request shows the error reported by the app's database span. These images document that session, not current backend availability.
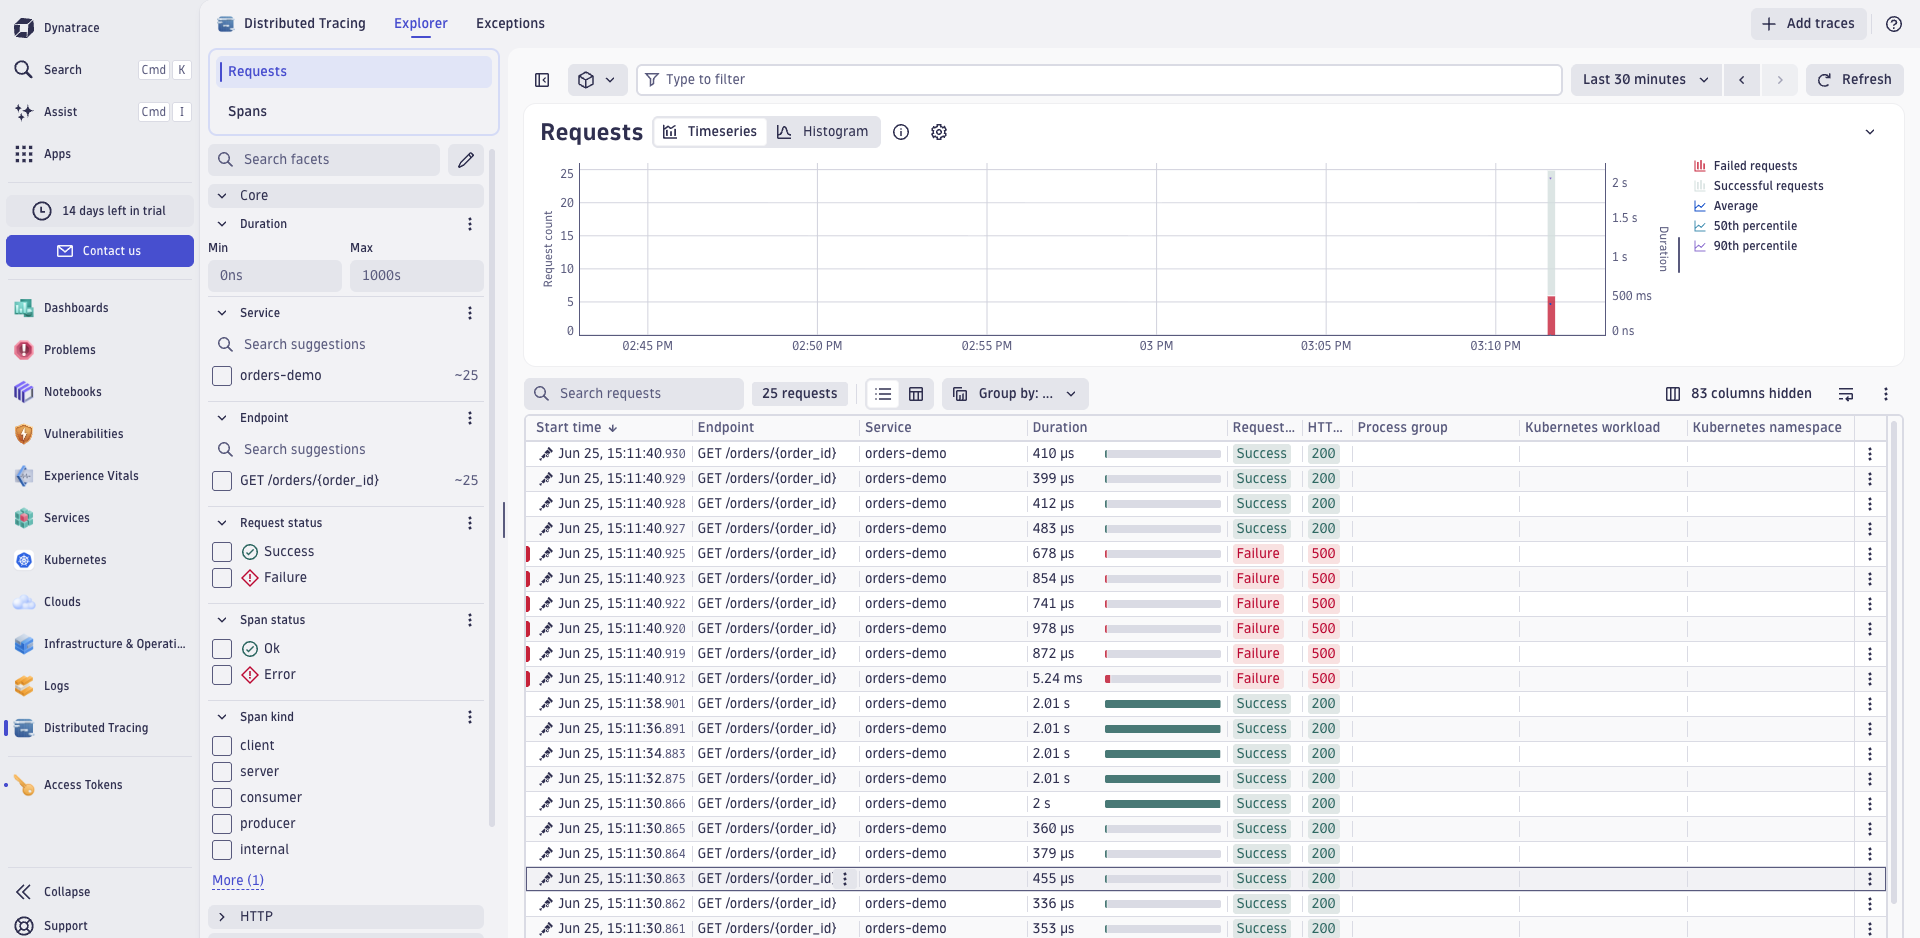
The orders-demo service in Dynatrace, showing a list of requests with successes and failures.
01 · the service, in Dynatrace

The orders-demo app in Dynatrace. Each row is a real request; the red ones are the failures created by flipping the break button to error.
Open the request screenshot at full size

A single failing request trace in Dynatrace, with the db.query step marked as the error.
02 · one failing request, opened up

The failure trace has an automatic HTTP server span above the manual orders.get and db.query spans. The database span records the error; the simulated shipping step was not reached.

Open the failure trace screenshot at full size

§ 05

What this is,
and isn't

Faultline is a deliberately tiny demo, not a real production system. Its job is to make one thing concrete: the exact loop a Solutions Engineer walks a customer through.

it's the make-it-then-watch-it loop

Send sample requests, introduce a known fault, and inspect the response and trace together. This demonstrates a troubleshooting walkthrough, not a measured reduction in diagnosis time.

it's three orders, in memory

No real database, no real shipping service. The point isn't size; it's showing how a failure becomes visible the moment an app reports what it's doing.

the monitoring is real

The data streamed into an actual Dynatrace trial account, and the screenshots above are from that session — real, not a mock-up. That trial has since expired.

nothing secret is shared

The Dynatrace side was a free trial, and the access key lived only in a local .env file that is never uploaded to the public code.